Introducing "Tidy" Data
From the 'Introduction to Statistical Programming in R and Python' course we are familiar with a data frame in R: a rectangular spreadsheet-like representation of data in R where the rows correspond to observations and the columns correspond to variables describing each observation. In Week 1 of Data Analysis Skills, we started explorations of our first data frame flights included in the nycflights13 package by creating graphics using this data frame.
In this session, we extend some of these ideas by discussing a type of data formatting called tidy data. Beyond just being organized, in the context of the tidyverse having tidy data means that your data follows a standardized format. This makes it easier for you and others to visualize your data, to wrangle/transform your data, and to model your data. We will follow Hadley Wickham's definition of tidy data here:
A dataset is a collection of values, usually either numbers (if quantitative) or strings/text data (if qualitative). Values are organised in two ways. Every value belongs to a variable and an observation. A variable contains all values that measure the same underlying attribute (like height, temperature, duration) across units. An observation contains all values measured on the same unit (like a person, or a day, or a city) across attributes.
Tidy data is a standard way of mapping the meaning of a dataset to its structure. A dataset is messy or tidy depending on how rows, columns and tables are matched up with observations, variables and types. In tidy data:
- Each variable forms a column.
- Each observation forms a row.
- Each type of observational unit forms a table.
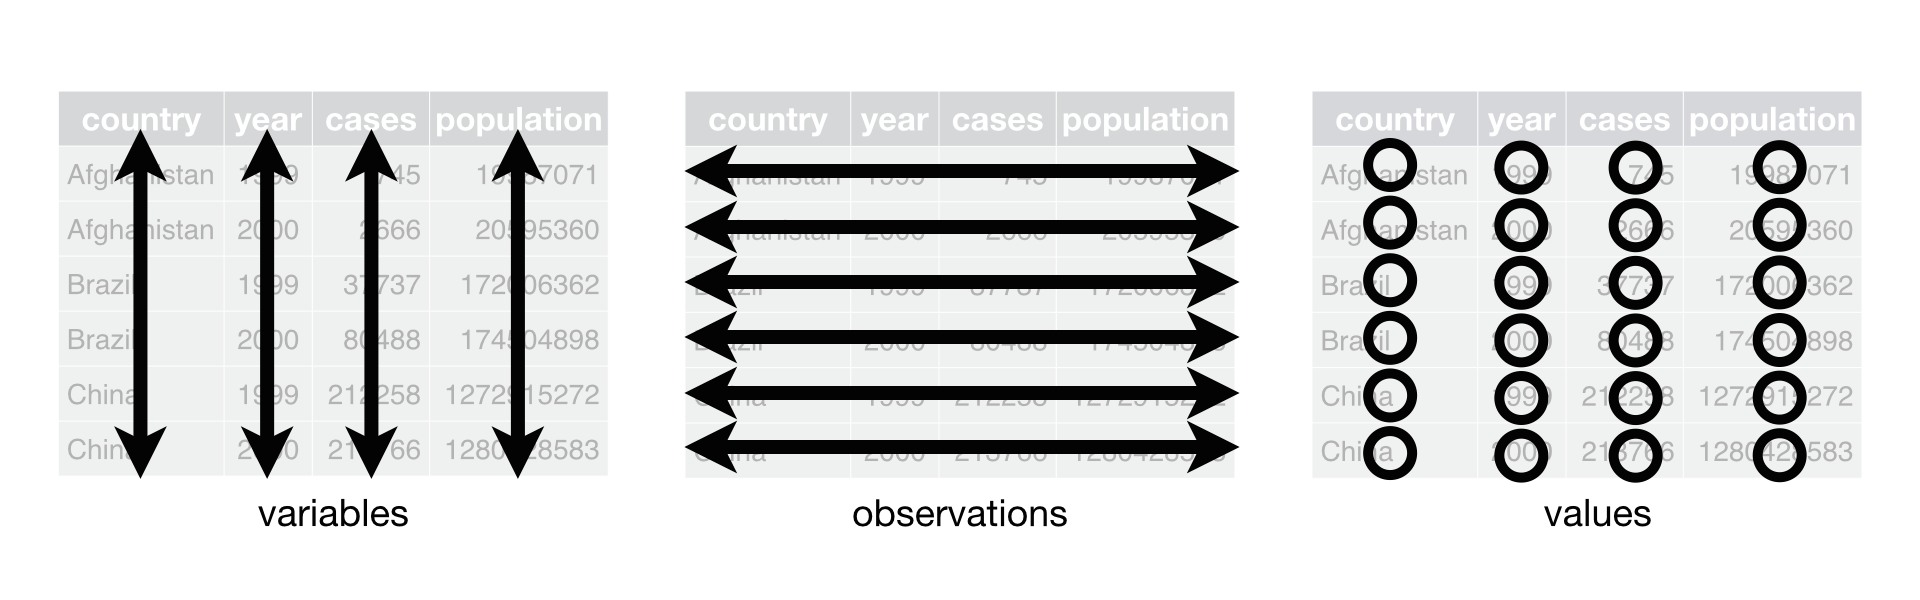
Figure 1: Tidy data graphic from http://r4ds.had.co.nz/tidy-data.html
For example, say the following table consists of stock prices:
| Date | Boeing Stock Price | Amazon Stock Price | Google Stock Price |
|---|---|---|---|
| 2009-01-01 | $173.55 | $174.90 | $174.34 |
| 2009-01-02 | $172.61 | $171.42 | $170.04 |
Although the data are neatly organized in a spreadsheet-type format, they are not in tidy format since there are three variables corresponding to three unique pieces of information (Date, Stock Name, and Stock Price), but there are not three columns. In tidy data format each variable should be its own column, as shown below. Notice that both tables present the same information, but in different formats.
| Date | Stock Name | Stock Price |
|---|---|---|
| 2009-01-01 | Boeing | $173.55 |
| 2009-01-02 | Boeing | $172.61 |
| 2009-01-01 | Amazon | $174.90 |
| 2009-01-02 | Amazon | $171.42 |
| 2009-01-01 | $174.34 | |
| 2009-01-02 | $170.04 |
However, consider the following table:
| Date | Boeing Price | Weather |
|---|---|---|
| 2009-01-01 | $173.55 | Sunny |
| 2009-01-02 | $172.61 | Overcast |
In this case, even though the variable "Boeing Price" occurs again, the data is tidy since there are three variables corresponding to three unique pieces of information (Date, Boeing stock price, and the weather that particular day).
The non-tidy data format in the original table is also known as "wide" format whereas the tidy data format in the second table is also known as "long/narrow" data format.
In this course, we will work mostly with data sets that are already in tidy format even though a lot of the world's data isn't always in this nice format.
Task Consider the following data frame of average number of servings of beer, spirits, and wine consumption in three countries as reported in the FiveThirtyEight article Where Do People Drink The Most Beer, Wine And Spirits?
# A tibble: 3 × 4
  country     beer_servings spirit_servings wine_servings
  <chr>               <int>           <int>         <int>
1 Canada                240             122           100
2 South Korea           140              16             9
3 USA                   249             158            84
This data frame is not in tidy format. What would it look like if it were? Try and reproduce the table above in tidy format just by typing/copying/pasting text (i.e. DON'T use R code here).
There are three variables of information included: country, alcohol type, and number of servings. In tidy format, each of these variables of information are included in their own column.